Faster Time to Revenue Means Ditching the Spreadsheet
We know that the average marketer spends 40% of their day collecting and analyzing marketing data from a variety of sources to ultimately organize and build fundamental reports. These are backbreaking and formidable tasks that are further complicated by siloed information. And after all the effort, the results are oftentimes questioned due to human involvement and data integrity. Let’s face it, not every marketer has a data science degree. But, having the right data is imperative for marketing professionals to know where to adjust campaigns and budgets and for senior leadership to make sure they have a pulse on the cost and benefit of revenue team activities. You can’t forecast accurately without it. Period.
These daunting tasks are being complicated every single day with more and more data and more and more demand to get the most out of the data. Marketers find themselves saying, “there must be a better way.”
What if I could tell you there is a better way? Is there a way to now automate these cumbersome yet important marketing tasks and remove the shackles of manual collection? Is there a way to visualize and report on spend performance from first touch to close? Imagine a world where your weekly c-level reports could write themselves and your marketing team could get the credit. Marketers, I have good news, there is a way.
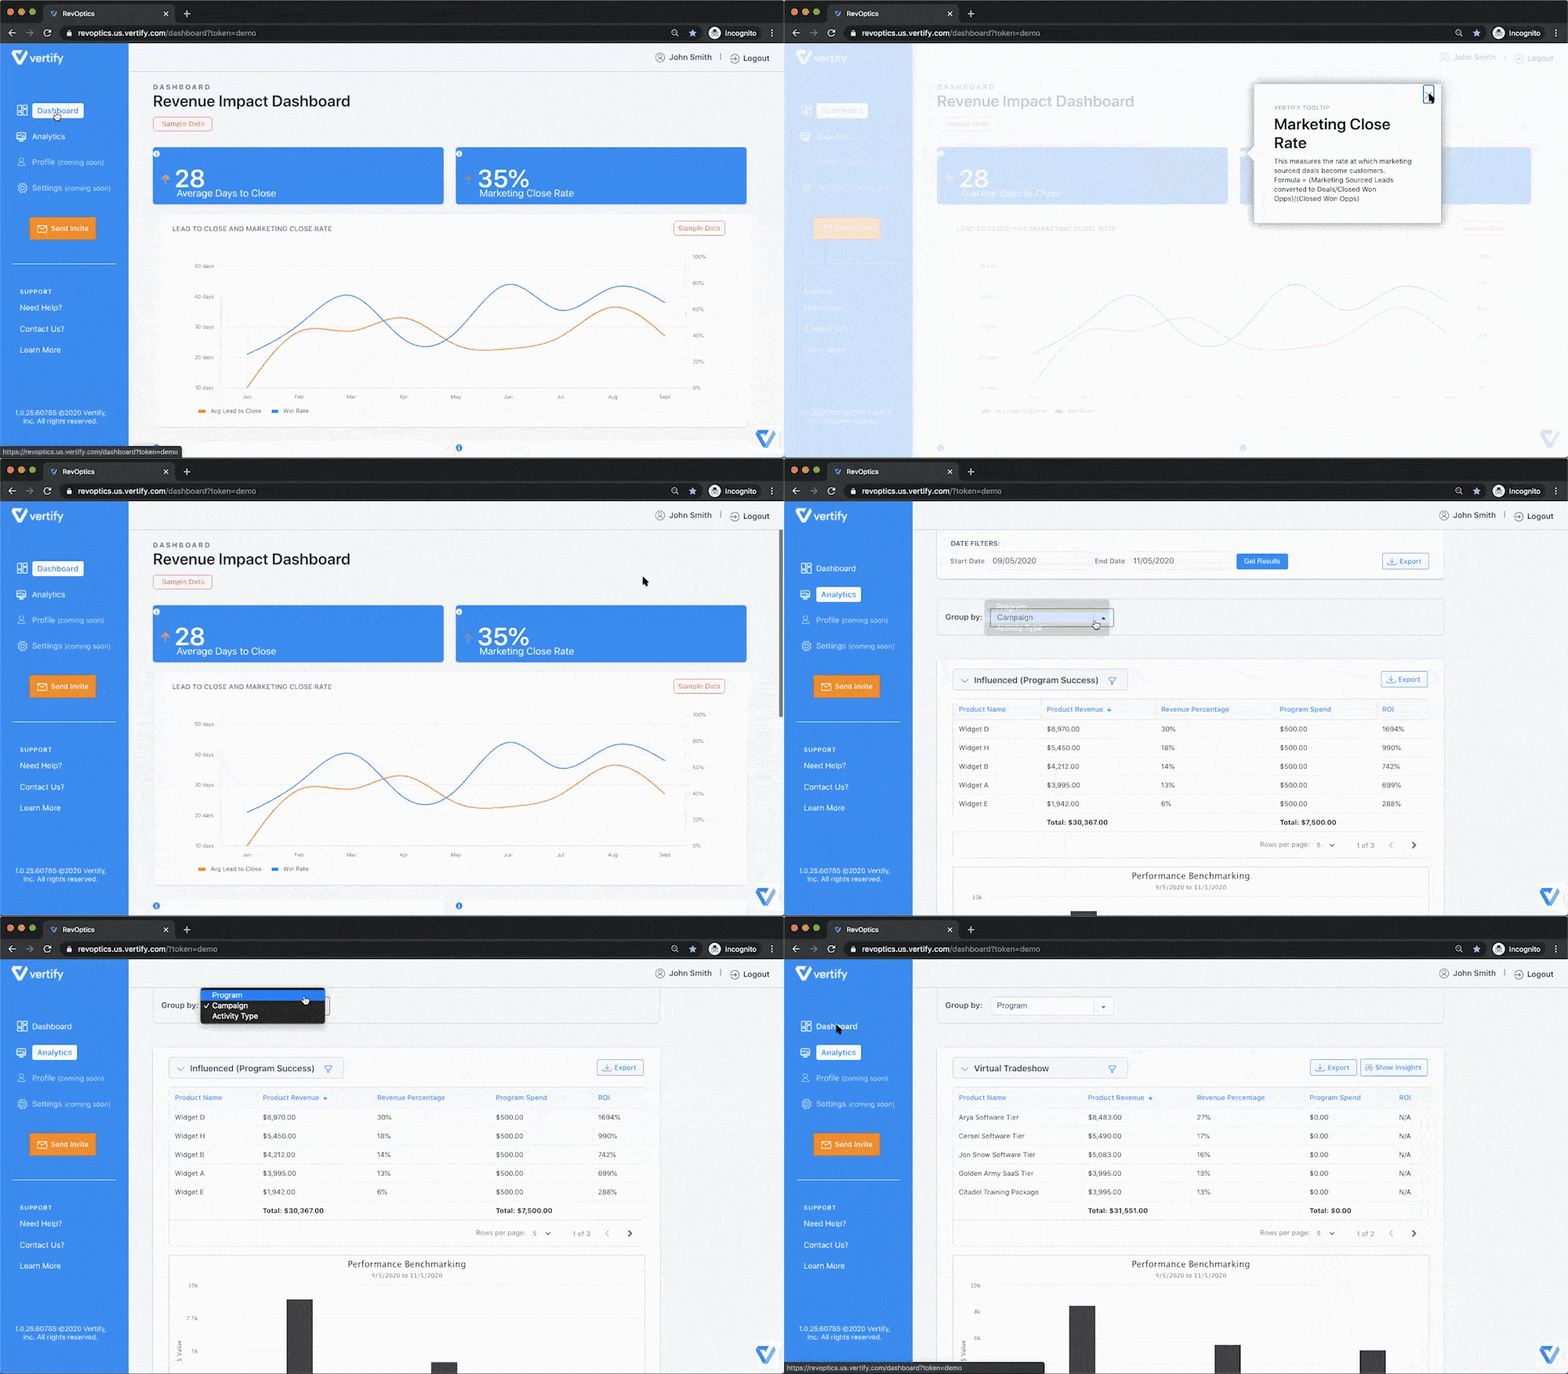
We are thrilled to announce the Vertify Revenue Impact Dashboard. This dashboard can work both with our data automation platform to further the value you are already receiving from Vertify or as a stand-alone reporting platform. The dashboard enables your marketing teams to visualize and communicate your budget and campaign performance as it is tied to revenue. In short, it empowers you to understand how your activities are affecting your forecast so that you can adjust for more precise forecasting and generate a faster time to revenue. It does all of this by automatically collecting data from your marketing automation platform and your CRM to give you the whole truth, not half-truths based on data from one siloed system.

Real-Time Campaign Insights, Instantly
With Vertify’s Revenue Impact Dashboard, you don’t have to guess which campaigns or activity types are working and which ones are coming up short. You no longer have to wonder if your budget dollars are being spent wisely. When you are in the dashboard, you will see five charts that are automatically populated with real-time mission-critical activity insights which enable you to take action. You literally do not have to configure a single thing. Everything is done for you so that you can focus on taking action. After all, insights are only insights if they empower you to be able to take action. Want to drill into the data? You can drill into the data with the next best action diagnostics and even go deeper with more granular reports, when applicable. Bottom line — the dashboard empowers action, freeing you from the manual marketing data overlord.
Faster Time to Revenue Starts with 5 Charts
The Revenue Impact Dashboard displays five charts based on combined data from sales and marketing for visualizing and communicating revenue data in an easy-to-understand, actionable way. These metrics-that-matter eliminate blind spots in your traditional revenue reporting.
Average Days from Campaign to Revenue: Most reporting only focuses on when a lead goes into the CRM and measures from SQL to close. It’s much more accurate for overall revenue reporting to show the average number of days for a lead to become a customer, starting from the first marketing touch.
Marketing Close Rate: This measures the rate at which marketing sourced deals become customers.
Lead Gen By Industry: This displays the number of leads generated by industry type so that you can make sure to target the right industries.
Average Contract Value of Marketing Sourced Deals: It is vital to understand which deals are actually being won. Are they marketing sourced or sales sourced? This shows you the average amount of closed won opportunities that were actually marketing sourced.
Lead Conversion Performance by Campaign: Understanding which campaigns are driving the best outcomes matters. This shows you the conversion rate from Lead to Opportunity by Campaign.
The time to make adjustments to campaigns is not after you have spent thousands of dollars on a dead-end campaign. The time is at the beginning and while in flight. You must be able to look at objective information and make objective, data-driven choices that allow you to right the ship. With automated, real-time reporting, you not only save time, but you legitimize action. If you notice something is off track, the dashboard puts you in a position to fix it.
“We’re no longer spending six hours a week doing the tedious task of analyzing and organizing our data. With Vertify’s help, we can now get that done in 30 minutes a week, which means that I’ve got five and a half hours back to devote to other projects.” –Kevin Keefe, Marketing Manager, CADimensions
Now is the Time to Report with Ease & Confidence
Whether you are struggling with time-consuming manual reporting and data collection, sick and tired of living in spreadsheets, or using another BI tool that has yet to give you insights that promote action, now is the time to consider the Vertify Revenue Impact Dashboard. This dashboard makes it easy to understand precisely how your marketing activities are impacting growth. Try the Revenue Impact Dashboard for free today and take control of your data reporting.